Q2 Earnings
We are nearing the end of Q2 earnings season excitement with more than 90% of the S&P 500 having already released their quarterly results. Reports from the handful of publicly traded built-world SaaS leaders have provided us with some insights into this paper-trailing industry’s tech adoption as we close in on that illustrious inflection point (25%+ sector adoption).
Leading Construction Management platforms like Procore, Trimble, and Bentley Systems, depicted strong double-digit subscription-fueled growth of 33%, 24%, and 12%, respectively, all surpassing the low double-digit to negative growth metrics of the US market's 5 trillion-dollar tech giants (aka Microsoft, Alphabet, Apple, Amazon, and Nvidia).
Procore’s (NYSE: PCOR) Q2 results outpaced management guidance and Wall Street estimates across the board, demonstrating a 33% YoY sales growth on an unexpected operating margin improvement that brings this high-growth Construction Tech giant just 1% away from operational profitability (a figure that sat at -15% just 1 year ago).
Procore’s seemingly conservative management team – having surpassed its internal earnings expectations by a growing percentage in the last 4 consecutive earnings reports – once again lifted its forward guidance.
The continuous outperformance of the built world's SaaS leaders furnishes the early-stage market with optimistic signals of adoption.
But why is the market selling Procore shares following this unmistakably bullish earnings report?
Pulling profits is a natural function of the public markets following the type of market run PCOR had since the year began, having lifted over 80% from its lows at the beginning of the year, and these quarterly reports represent a catalyst for action. The market had priced for this beat, and raise in management guidance, so I wouldn't read too far into the post-earnings price action at this juncture.
Procore has staked its claim as a must-have solution for any digitally inclined AEC player's tech stack, but that does not mean it is the most effective. With a less than $10 Billion market cap in a $7 Trillion market, there is plenty of room for well-positioned new entrants to play their hand.
The CPI Report
July's Consumer Price Index (CPI) reading, the US benchmark for inflation, came in below economists’ projections but ticked higher for the first time in 12 months on a year-over-year basis.
But what does this actually mean?
To understand the implication of this uptick in inflation we first need to identify the underlying driver(s). According to the US Bureau of Labor Statistics, more than 90% of this increase in June’s CPI reading could be attributed to a rise in shelter costs, with motor vehicle insurance being a distant second.
YoY Change in The Cost of Shelter
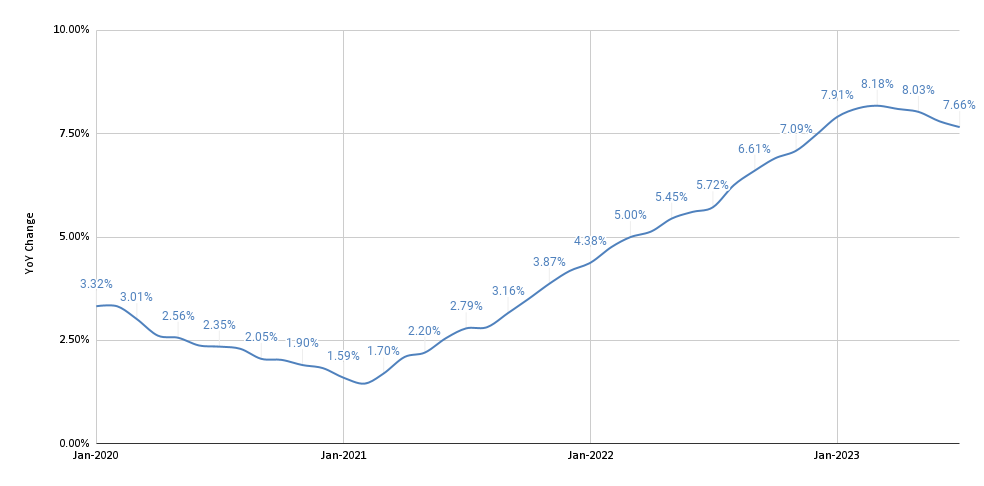
What this tells us is that housing demand continues to outpace the current supply, specifically in those post-COVID transplant cities. The cost of shelter has risen 18% above pre-pandemic levels in the US, but the good news is that this historically “sticky” inflationary metric has decelerated for 4 consecutive months, signifying abating pricing pressures in the most significant driver of inflation today.
Annualized Monthly US Construction Spending
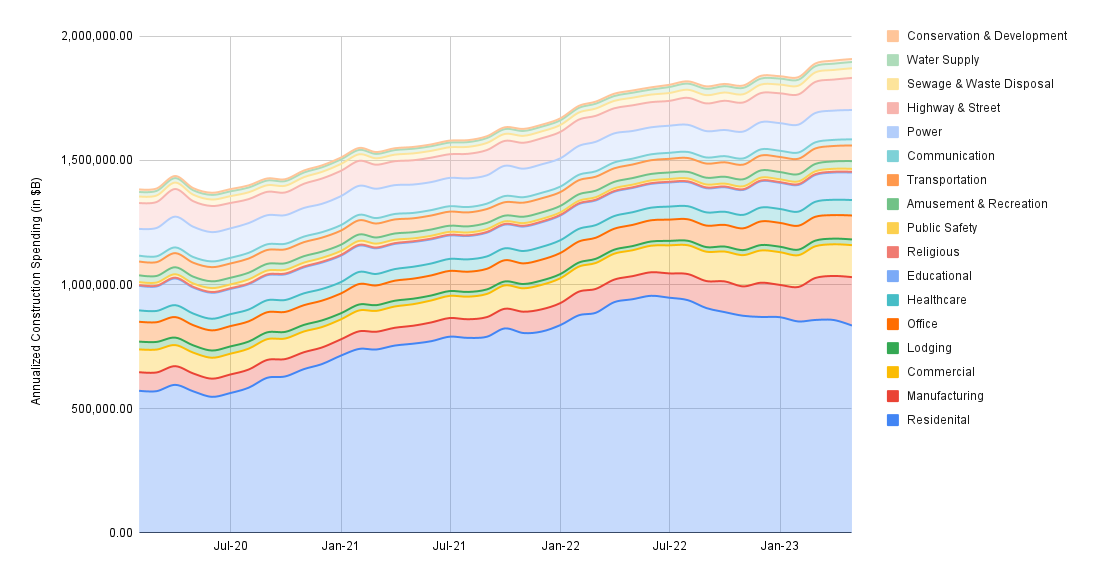
Outsized housing demand is slowly but surely being satisfied by the boundless construction boom the US has been experiencing. US construction spending has been driven to new all-time highs for the past 5 consecutive months, with next-generation manufacturing (autonomous/semi-autonomous plants) investments leading the charge, coupled with a torrent of government incentives for upgrading & digitizing our physical infrastructure, persistent demand for multifamily housing, and buoyant industry backlogs, this trend isn’t poised to reverse anytime soon.
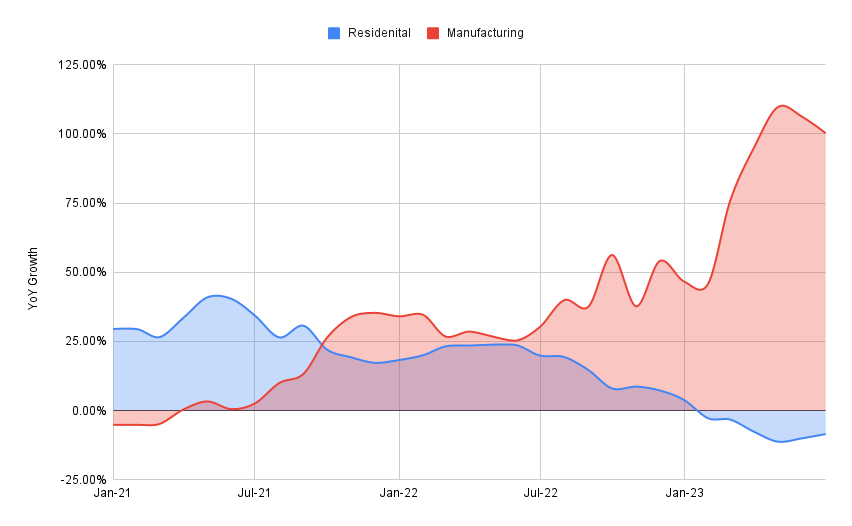
The building boom began as a traditional residentially fueled housing cycle but has since evolved toward something much more monumental, a systemic advancement in economic structure: Industry 4.0.
YoY Increase in Construction Spending: Manufacturing vs. Residential
Top 3 Weekly Deals

$35M | Series C | 8/10/2023
Investors: Co-led by Inven Capital & Insight Partners with Taronga Ventures
WINT water management system detects and stops leaks at the source using Artificial Intelligence. It alerts you when water is leaking and can automatically shut it off. Intelligent real-time monitoring identifies sources of leaks and waste preventing damage, reducing consumption, and cutting the resulting carbon emissions.
$2.3M | Seed | 8/10/2023
Investors: Led by Wingman Ventures with participation from Vento Ventures, Getty Capital, and angel investors
Saeki Robotics makes 3D-printed formwork to make non-standard and custom construction elements risk-free. Providing a cost-effective, sustainable solution for low-volume production of non-standard concrete elements. We provide the complete solution to realizing architects’ designs, solving engineers’ dilemmas, and enabling construction workers to build non-standard elements with ease.
$3.35M | Series A + | 8/7/2023
Investors: Undisclosed
Skyline Robotics was established with the idea of building a better tomorrow - today. Skyline brings together a group of innovative developers with a shared clear vision of a future in which robots assist humans in work and everyday activities. Our mutual knowledge is based on robotics, software engineering and mechatronics. Skyline Robotics is taking an archaic industry such as window cleaning - which has remained the same since its inception more than a century ago - and giving it the breakthrough modernization it needs.


Discussion
Be the first to leave a comment.
You must be a member of the BuiltWorlds community to join the discussion.